Adobe New AI Tool Turns Anyone into an Infographics Wizard
Adobe will preview Project Infographics It at Sneaks this week, a tool that uses generative AI to create customizable infographics out of data sets and text descriptions.
Adobe New AI Tool Turns Anyone into an Infographics Wizard: In just a fraction of the time, Adobe hopes artificial intelligence can breathe life into your infographics.
Adobe will preview Project Infographics It at Sneaks this week, a tool that uses generative AI to create customizable infographics out of data sets and text descriptions.
Adobe’s analytics evangelist, Eric Matisoff, tells Fast Company the tool is meant to make infographics and data more accessible. “It’s not just for business intelligence or analytics anymore,” he says.
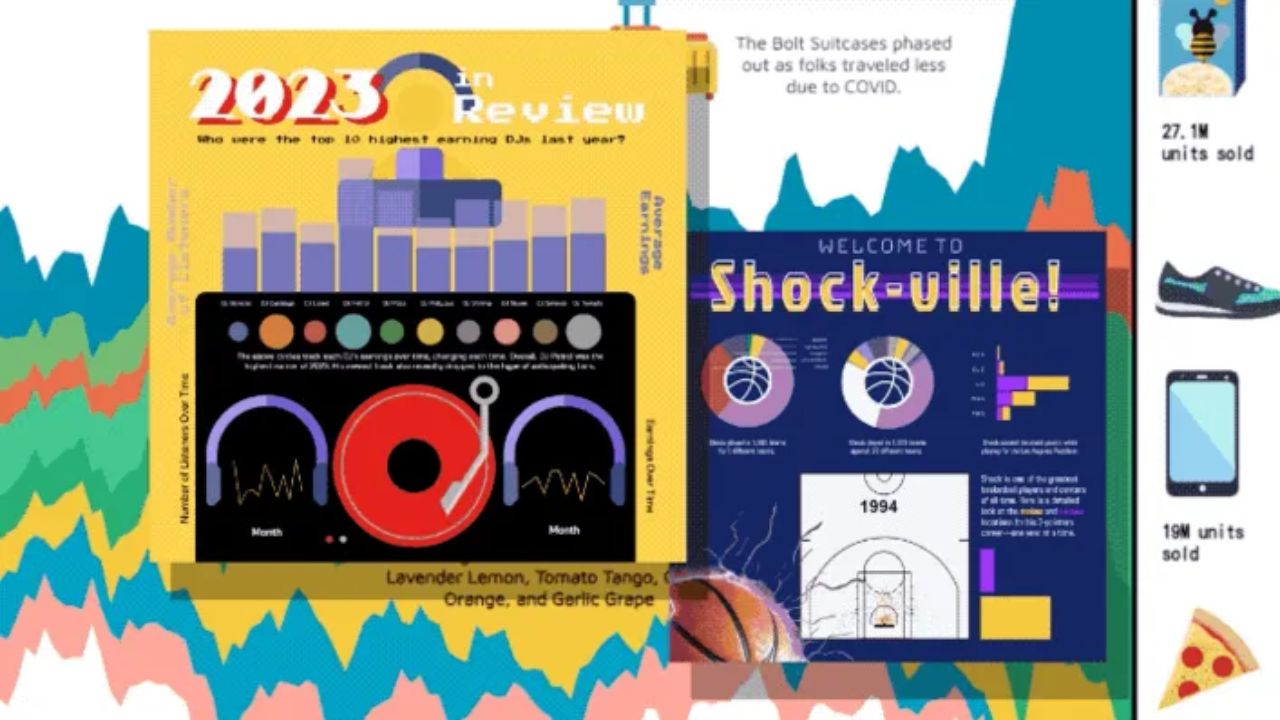
Making an infographic requires a mix of design skills, data analysis expertise, and graphics knowledge. With Project Infographics It, all you need is raw data and a prompt.
“I think about all the time I’ve spent analyzing, doing in the product, exporting to Excel, then bringing that into PowerPoint, then finally delivering it and someone complaining like, ‘how come it’s not animated or how come it’s not using the right colors,’” says Matisoff.
Check Out: Explore 5 Intel® Core™ Ultra-Powered Laptops, Unlock Your AI Experience
Tongyu Zhou demonstrated how Adobe research scientist intern Project Infographics It could turn a fictional basketball player’s stats into basketball-themed infographics for Fast Company ahead of Sneaks.
In order to create an infographic, Adobe’s system requires two main pieces of information: data and prompt. For this case, the prompt identified the sport—basketball—and the team’s colors—purple and gold. After importing this data, Zhou displayed all the hits and misses of the two-pointer. The tool quickly generated a variety of charts, including a scatter plot that could be placed over an image of a basketball court, with purple and gold colors.
It supports all chart types, including bar charts, line charts, circle plots, and stream plots, all of which can be animated.
The company gauges feature interest to determine which tools to prioritize based on Sneaks features, Matisoff says.
Check Out: SRK in Animal Instead of Ranbir Kapoor? AI-Generated Video Sparks Frenzy Among Fans