Get ready for an exciting change in web metrics! Coming up in March 2024, Interaction to Next Paint (INP) will take center stage, replacing the current First Input Delay (FID). This new metric assesses responsiveness using data from the Event Timing API, promising a more comprehensive and user-centric measurement. In this blog, we’re diving deep into INP. We’ll cover the nitty-gritty details, like what it is, how we measure it, why it matters more than ever, and how it differs from the old FID. Plus, we’ll explore its impact on SEO, the magic behind the scenes, and strategies to crank up those impressive INP scores. Get ready for a journey into the heart of web optimization!

What is Interaction to Next Paint (INP)?
Interaction to Next Paint (INP) is a web performance metric that assesses the responsiveness of a webpage to user interactions. It measures the time it takes for a webpage to update its visual content after a user interaction, such as clicking a button or link. A low INP score indicates a responsive webpage, while a high INP score indicates a slow and unresponsive webpage.
INP is a pending Core Web Vital metric, which means that it is one of the key factors that Google considers when ranking websites in its search results. INP is expected to replace First Input Delay (FID) as a Core Web Vital metric in March 2024.
How is INP Measured?
INP (Interaction to Next Paint) is a web performance metric that assesses how responsive a web page is to user interactions. It measures the time it takes for a web page to update its visual content after a user interaction, such as clicking a button or link.
INP is measured using the Event Timing API, which is a JavaScript API that provides information about the timing of user interactions. The Event Timing API provides two key metrics for measuring INP:
First Input Delay (FID): The time it takes for the browser to start processing a user interaction event.
Visual Change Delay (VCD): The time it takes for the browser to paint a new frame of the web page after the browser has started processing a user interaction event.
To measure INP, the Event Timing API is used to record the time it takes for the browser to process a user interaction event, and the time it takes for the browser to paint a new frame of the web page after the browser has started processing a user interaction event. The difference between these two times is the INP score.
INP, or Interaction-to-Next-Paint, checks how quickly a webpage responds when you do things like clicking, tapping, or typing. It looks at all these actions and notes the slowest one, ignoring any weird ones.
Here’s how it works?
Imagine you’re on a website with lots of buttons and things to click. INP looks at all your clicks, and the one that takes the longest time is what gets reported. But if there are many clicks and something weird happens that makes one of them take way longer than usual, we ignore that weird one for every 50 clicks. Most websites don’t have that many clicks, so we usually just report the slowest one. Then, we figure out the 75th percentile of all the times people visit the page, throwing out any really strange cases. This way, we get a number that shows what most people experience or even something better.
An interaction is just a bunch of things that happen when you do something on the webpage. For example, when you tap on your phone screen, it involves a few different events like when you touch the screen, lift your finger, and the screen responds. These interactions can be caused by different things like code (JavaScript), design styles (CSS), or built-in parts of your browser (like form buttons).
The speed of an interaction is all about how long the slowest part of it takes—from when you start doing something to when you actually see a response on the screen.
User Interactions Considered for INP
Interaction to Next Paint (INP) considers the following user interactions:
Mouse clicks: INP measures the time it takes for a web page to update its visual content after a user clicks on a mouse button.
Taps (on a touch screen): INP measures the time it takes for a web page to update its visual content after a user taps on a touchscreen device.
Key presses (physical or onscreen keyboard): INP measures the time it takes for a web page to update its visual content after a user presses a key on a physical keyboard or an onscreen keyboard.
INP does not consider hovering or scrolling. Hovering is the act of moving the mouse cursor over an element on a web page. Scrolling is the act of moving the content of a web page up or down.
Here is a table summarizing the user interactions considered for INP:
- Mouse Click: Pressing a mouse button on a web page
- Tap (on a touch screen): Pressing a finger on a touchscreen device to interact with a web page
- Key Press: Pressing a key on a physical or onscreen keyboard to interact with a web page
Breakdown of INP Components: Input Delay, Processing Time, and Presentation Delay
Here’s a breakdown of the three components of INP:
Input Delay: Input delay refers to the time it takes for a user’s interaction to be registered by the browser. This delay can be caused by a number of factors, including:
Long tasks on the main thread: The main thread is the thread that handles the user interface. If the main thread is busy with other tasks, such as loading graphics or playing sound, it may not be able to respond to input events immediately.
Slow JavaScript code: JavaScript is a scripting language that is often used to write web page code. If the JavaScript code is slow, it can take longer for the browser to respond to input events.
Inefficient Event Handling: The way that input events are handled can also affect input delay. For example, if the event handling code is inefficient, it can take longer for the browser to process the input event.
Processing Time: Processing time refers to the time it takes for the browser to execute the code that is triggered by a user interaction. This includes the time it takes for the browser to parse the code, compile it, and run it. Processing time can be caused by a number of factors, including:
The amount of code: The more code there is on a web page, the longer it will take the browser to execute the code.
The complexity of the code: Complex code can take longer to execute than simple code.
The performance of the device: The performance of the device that is used to access the web page can also affect processing time. For example, a web page may take longer to load on a slow device than on a fast device.
Presentation Delay: Presentation delay refers to the time it takes for the browser to update the display after the code has been executed. This includes the time it takes for the browser to calculate the layout of the page, render the graphics, and paint the new frame to the screen. Presentation delay can be caused by a number of factors, including:
The complexity of the page layout: A complex page layout can take longer to calculate than a simple page layout.
The size of the graphics: Large graphics can take longer to render than small graphics.
The performance of the graphics card: The performance of the graphics card can also affect presentation delay. For example, a web page may take longer to load on a device with a slow graphics card than on a device with a fast graphics card.
Reducing input delay, processing time, and presentation delay can help to improve the overall responsiveness of a web page. This can lead to a more satisfying user experience, and it can also help to improve the page’s search engine ranking.
Difference between INP and First Input Delay (FID)
INP and FID are both web performance metrics that measure the responsiveness of a web page. However, there are some key differences between the two metrics.
First Input Delay (FID) measures the time it takes for the browser to start processing a user interaction event. This means that the user has already interacted with the page, such as clicking on a button or link, but the page has not yet responded to the interaction.
Interaction to Next Paint (INP) measures the time it takes for the browser to update its visual content after a user interaction. This means that the page has processed the user’s interaction and has begun to update the way it looks on the screen.
In other words, FID measures the first interaction, while INP measures subsequent interactions.
Here is a table summarizing the key differences between INP and FID:
Feature INP FID
- Focus Subsequent interactions First interaction
- Measurement Time to update visual content Time to start processing interaction event
Use case Measures overall responsiveness of a page Measures responsiveness of the page to the first interaction - INP is expected to replace FID as a Core Web Vital metric in March 2024. This is because INP is a more comprehensive measure of responsiveness and is more likely to reflect how users perceive the responsiveness of a web page.
Here are some of the reasons why INP is a better measure of responsiveness than FID:
- INP measures the time it takes for the browser to both process the interaction and update the visual content. This gives a more complete picture of how responsive the page is.
- INP is less likely to be affected by factors outside of the control of the website developer, such as the speed of the user’s internet connection or the performance of the user’s device.
- INP is more likely to be correlated with user satisfaction.
- Overall, INP is a more comprehensive and reliable measure of responsiveness than FID. This is why INP is expected to become the standard Core Web Vital metric for measuring responsiveness in the future.
Good and Poor INP Values
here’s a summary of good and poor INP values:
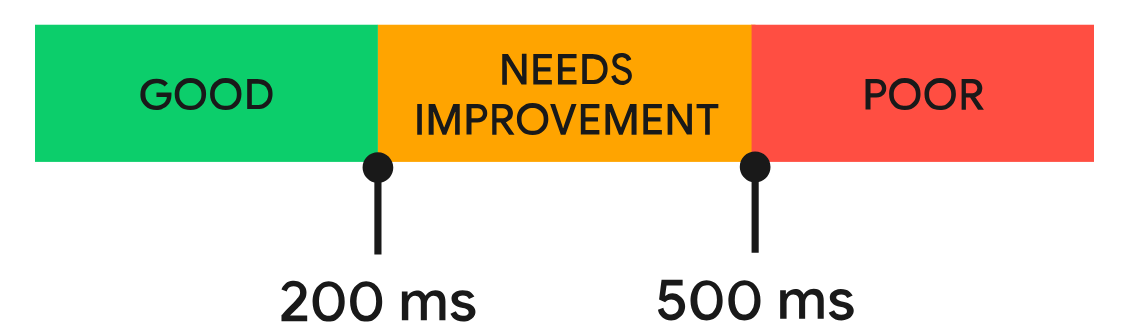
Good INP Values: A good INP value is considered to be 200 milliseconds or less. This means that the web page should update its visual content within 200 milliseconds of a user interaction. A low INP score indicates a responsive and user-friendly website.
Poor INP Values: A poor INP value is considered to be 500 milliseconds or more. This means that the web page takes too long to update its visual content after a user interaction. A high INP score indicates a slow, unresponsive, and frustrating website.
Here’s a table summarizing the INP value ranges and their corresponding descriptions:
| INP Value Range (milliseconds) | Description |
| 0-200 | Good |
| 201-500 | Needs Improvement |
| 501+ | Poor |
How to Measure Interaction to Next Paint with Field Data & Lab Data
Measuring Interaction to Next Paint (INP) with both field data and lab data provides a comprehensive understanding of how users experience your website’s responsiveness. Field data gathers real-world user interactions, while lab data provides controlled measurements under simulated conditions.
Measuring INP with Field Data
Collect real-user browsing data: Utilize tools like Chrome User Experience Report (CrUX) or Google Search Console to collect anonymized data about user interactions on your website.
Analyze INP distribution: Analyze the distribution of INP values to identify patterns and performance trends across different user segments and geographies.
Identify performance bottlenecks: Pinpoint specific pages or interactions with high INP values to prioritize optimization efforts.
Measuring INP with Lab Data
- Use lab testing tools: Use tools like Lighthouse or Page Speed Insights to simulate user interactions and measure INP under controlled conditions.
- Test on various browsers and devices: Run tests on a variety of browsers and devices to represent the diverse user environment.
- Replicate real-world scenarios: Emulate real-world conditions by simulating network latency, device processing power, and content load times.
Combining Field Data and Lab Data
Compare field and lab data: Compare INP values obtained from field data with those from lab data to identify discrepancies and validate lab testing results.
Use lab data to inform optimizations: Utilize lab data to test potential optimization strategies and evaluate their impact on INP before deploying changes in production.
Continuously monitor INP: Continuously monitor INP values using both field data and lab data to track improvements and identify new areas for optimization.
By combining field data and lab data, you can gain a holistic understanding of your website’s INP performance and make informed decisions to enhance user experience and responsiveness.
How to Optimize Interaction to Next Paint?
- Optimizing Interaction to Next Paint (INP) is crucial for creating a responsive and user-friendly website.
- Enhancing Interaction to Next Paint (INP) requires effort, but the payoff is a superior user experience.
This guide outlines a path to boost INP:
Identify INP Issues:
- Gather data to pinpoint poor INP on your website.
- Utilize Real User Monitoring (RUM) for detailed insights, or Chrome User Experience Report (CrUX) for a broader overview.
Diagnose Slow Interactions:
- Start testing in the lab with field data suggesting slow interactions.
- Follow common user flows and test interactions during page load.
Optimize Interactions:
- Break down interactions into three phases: input delay, processing time, and presentation delay.
- Understand and reduce input delay caused by scripts, fetch handling, or overlapping interactions.
Optimize Event Callbacks:
- Yield to the main thread often, breaking up tasks to prevent long tasks.
- Structure code to allow rendering updates sooner, improving overall interaction responsiveness.
Minimize Presentation Delay:
- Reduce DOM size to expedite rendering.
- Leverage content-visibility property for lazy rendering of off-screen elements.
Be Mindful of HTML Rendering:
- Consider the performance costs of rendering HTML using JavaScript.
- Understand the implications of the single-page application (SPA) model on rendering and responsiveness.
Conclusion:
- INP improvement is an iterative process.
- Persistence is key; ongoing optimization will enhance user satisfaction.
- Expect to revisit and optimize interactions as you develop new features.
- Remember, the journey to a highly responsive website may take time, but the effort invested will contribute to a more satisfying user experience.
Tools to Measure Interaction to Next Paint (INP)
Here are some of the tools you can use to measure Interaction to Next Paint (INP):
PageSpeed Insights: PageSpeed Insights is another tool from Google that provides lab data for INP, along with other performance metrics. It simulates user interactions and measures INP under controlled conditions.
Lighthouse: Lighthouse is a built-in tool in Chrome DevTools that can measure INP, as well as other Core Web Vitals metrics. It provides both lab data and field data for INP.
Web Vitals Chrome Extension: The Web Vitals Chrome extension can measure INP in real time. It provides real-time feedback on your website’s INP performance.
DebugBear: DebugBear is a website performance monitoring tool that can measure INP, as well as other performance metrics. It provides detailed insights into INP issues and suggestions for improvement.
Web Vitals library: The Web Vitals library is a JavaScript library that can be used to measure INP programmatically. It allows you to obtain measurements from real users and send them back to your analytics provider.
INP Debugger: The INP Debugger is a Chrome extension that can be used to debug INP issues. It provides a visual timeline of user interactions and helps you identify the specific steps that are causing delays.
Google Search Console: Google Search Console tracks INP for your website over time. It provides historical data on INP performance and allows you to compare your website to others in your industry.
These are just a few of the many tools that are available for measuring INP. The best tool for you will depend on your specific needs and budget.
Here is a table summarizing the key features of each tool:
| Tool | Features |
| PageSpeed Insights | Lab data, field data |
| Lighthouse | Lab data, field data |
| Web Vitals Chrome Extension | Real-time feedback |
| DebugBear | Detailed insights, suggestions for improvement |
| Web Vitals library | Programmatic measurements |
| INP Debugger | Visual timeline, debugging tools |
| Google Search Console | Historical data, industry comparisons |
Challenges and Successes of Optimizing INP
Optimizing Interaction to Next Paint (INP) can be a challenging task, but it is also a rewarding one. Here are 10 challenges and successes of optimizing INP:
Challenges
Identifying the root cause of INP issues: INP is a complex metric, and there are many factors that can contribute to a high INP score. It can be difficult to identify the specific issues that are causing delays, especially for websites with complex codebases.
Optimizing without impacting other performance metrics: Optimizing INP often involves making changes to the code or infrastructure of a website. These changes can sometimes have unintended consequences, such as slowing down other performance metrics like First Contentful Paint (FCP) or Time to Interactive (TTI).
Balancing performance with user needs: It is important to balance performance optimization with the needs of users. For example, you may want to avoid using techniques that lazy load all images on a page, as this can make the page feel unresponsive for users who are scrolling quickly.
Keeping up with changes in browser technology: The way that browsers handle user interactions is constantly evolving, which can make it difficult to keep up with the latest optimization techniques.
Measuring INP in real-world scenarios: Lab data can provide valuable insights into INP performance, but it is important to also measure INP in real-world scenarios. This can be done using tools like Chrome User Experience Report (CrUX) or by conducting user testing.
Successes
Improved user experience: The most obvious benefit of optimizing INP is an improved user experience. A responsive website is more enjoyable to use and can lead to increased engagement and conversion rates.
Improved search engine ranking: Google has stated that INP will be a ranking factor in March 2024, so optimizing INP can help to improve your website’s position in search results.
Reduced bounce rate: A high bounce rate can indicate that users are frustrated with the performance of a website. Optimizing INP can help to reduce bounce rate and keep users engaged on your website.
Reduced development costs: In some cases, optimizing INP can be achieved by making simple changes to the code or infrastructure of a website. This can save time and money in the long run.
Improved team collaboration: Optimizing INP can require collaboration between different teams, such as development, operations, and marketing. This can lead to improved communication and collaboration across the organization.
In conclusion, optimizing INP offers significant benefits, including an enhanced user experience, improved search engine ranking, reduced bounce rates, cost savings, and improved team collaboration. While challenges exist in identifying root causes, balancing performance with user needs, and staying ahead of browser technology, the rewards of optimizing INP far outweigh the obstacles.